
September 10, 2026
The Department for Transport (DfT) expects all local highways authorities to publish information about their highways maintenance activities to help local taxpayers see the difference that funding is making in their areas.
What we are responsible for maintaining
Nottingham City Council (NCC) is responsible for managing and maintaining more than 825 kilometres of roads and 1300 kilometres of footways, as well as 36397street lights, 189 key bridges and structures, 167 traffic signalled junctions, 171 pedestrian signals, 37407 road gullies and other assets that make up the city’s highway infrastructure. In fact, highway infrastructure is the council’s largest physical asset. It would cost in the region of £2.5 billion to replace our highway infrastructure (gross replacement cost).
The table below details the highway network that NCC manages:
Lengths of highway, footways and cycleways (km)
| A road | B and C roads | Unclassified roads | Total roads | Footpaths | Other public rights of way | Cycleways |
|---|---|---|---|---|---|---|
| 82km | 67km | 676km | 825km | 1372km | 90km | 206km |
Road conditions in the City of Nottingham
Councils use road condition surveys to assess the state of their roads. The results are grouped into three categories:
- Green – the road is in good condition and no further investigation or treatment is required
- Amber – the road may need maintenance soon
- Red – The road is in poor condition and should be considered for maintenance
The published official statistics for road condition include more detail about the methodology, timing and coverage of this data. However, please note the additional information about the method used in Nottingham to collect road condition data.
A Roads
The table below details the condition of the City’s A Roads (major roads intended to provide large scale transport links, for example A6514 Western Boulevard, Nottingham). This information is collected annually. The significant differences between the figures reported for 2023 and 2024 are due to a change in survey method.
| Year | Percentage of road in red category | Percentage of road in amber category | Percentage of road in green category |
|---|---|---|---|
| 2023 | 9% | 53% | 38% |
| 2024 | 19% | 31% | 51% |
| 2025 | 19% | 31% | 51% |
B and C roads
The table below details the condition of the City’s B (roads intended to connect different areas, feed traffic between A roads and smaller roads on the network, for example B686 Carlton Road, Nottingham) and C Roads (smaller roads intended to connect unclassified roads with A & B roads, for example C183 Hartley Road, Nottingham). This information is collected annually:
| Year | Percentage of road in red category | Percentage of road in amber category | Percentage of road in green category |
|---|---|---|---|
| 2023 | 11% | 55% | 34% |
| 2024 | 21% | 23% | 56% |
| 2025 | 21% | 23% | 56% |
U roads
The table below details the condition of the City’s Unclassified (U) Roads. This information is collected annually:
| Year | Percentage of road in red category |
|---|---|
| 2023 | 13% |
| 2024 | 14% |
| 2025 | 14% |
Additional information on carriageway condition
We used to assess road condition in Nottingham using Surface Condition Assessment for the National Network of Roads (SCANNER) laser-based technology. However, in 2024 we switched to an alternative survey type referred to as an Annual Engineering Inspection (AEI) because we felt the data returned by AEI was a truer reflection of the network and its maintenance requirements.
The change in survey type means that it’s not possible to make direct comparisons with other local authorities still using SCANNER technology. In addition, we would caution against comparing current road conditions in Nottingham with data recorded prior to 2024. The results for 2024 are repeated for 2025 in the above tables due to late delivery of some survey data, included in table 5 below, which illustrates the effect of our increased investment in road maintenance.
| Percentage of road in red category | Percentage of road in amber category | Percentage of road in green category | |
|---|---|---|---|
| A Roads | 15% | 39% | 46% |
| B&C Roads | 16% | 23% | 61% |
| U Roads | 11% | 28% | 61% |
What is a pothole?
Nottingham City Council has embraced the risk-based approach to highway safety inspections proposed in the Code of Practice. This means that our response to safety defects can vary according to site specific circumstances (described in detail on page 15 of our manual). We suggest investigatory levels but rely on the professional judgement of highway safety inspectors to determine whether / when a safety defect requires intervention.
| Defect | Asset group | Investigatory level |
|---|---|---|
| Pothole | Carriageway | Depth 50mm or greater |
| Pothole | Footway & cycleway | Depth 25mm or greater/Depth 20mm or greater in M201 |
Our investigatory levels suggest that potholes are defined as safety defects in the surface of carriageways (roads) at least 50mm deep, or at least 20mm deep in the surface of footways in very busy areas of the city with high public space and street scene contribution. In areas of roads used frequently by pedestrians, such as crossing points, we apply the footway investigatory levels.
What we are doing to tackle potholes
Routine safety inspections are undertaken to identify defects that are creating or likely to create a danger or serious inconvenience to users of the network or the wider community. Every road in Nottingham is inspected at least once a year. Our busiest roads and footpaths are inspected every month. Additional inspections are carried out to investigate defects reported to us by customers. In most cases we do this within three days of receiving a report.
Dangerous defects (potholes) should be made safe within 36 hours of our inspection. We can’t always make a permanent repair in the first instance due to the time constraints. In this case we will either make a temporary repair or erect safety barriers around problem area. When we make a temporary repair, we will continue to monitor its condition so that a permanent fix can be scheduled when appropriate.
Between April 2025 and March 2026, we repaired 9700 m2 of highway surface defects.
How members of public can report potholes and other highway defects
All interaction with the public is managed in accordance with the principals laid out in our Customer Charter. Customers are encouraged to report highway defects via the NCC website (Report a problem). Road and pavement issues are logged in ‘Confirm’ via the Customer Enquiries Module. The system automatically forwards the details to the relevant highway inspector for action and provides periodic updates for registered users on our progress towards resolving their problem.
We don’t currently accept reports from third party reporting sites such as FixMyStreet.
What happens after a pothole is reported
When a pothole is reported to us an appropriately trained and certified highway inspector will schedule an inspection to make an assessment. We aim to carry out inspections no later than three days after a defect has been reported us. Whilst preferable, it’s not always safe to undertake a walked inspection, in which case a suitably equipped vehicle will be used for a driven inspection. Details of the reported defect (such as size depth and road location) will be captured and used to determine the degree of risk to the public. Works to resolve any defects identified by the inspector will be issued to the relevant teams and prioritised according to the level of risk.
What we spend to maintain the highway network and where the funding is coming from
| 2024-25 | 2025-26 | 2026-27 (projected) | |
|---|---|---|---|
| Total spend on highways maintenance | £5,110,000 | £8,929,000 | £14,386,000 |
| Of which spent on: | |||
| Carriageways | £3,984,000 | £7,009,000 | £11,015,000 |
| Footways | £338,000 | £682,000 | £1,844,000 |
| Structures | £499,000 | £838,000 | £800,000 |
| Drainage | £200,000 | £266,000 | £588,000 |
| Street lighting* | £ | £ | £ |
| Other assets | £90,000 | £133,000 | £139,000 |
*Street lighting in Nottingham is maintained under a Private Finance Initiative (PFI) contract
Where our funding for highways maintenance comes from
| Funding sources for highways maintenance | 2024-25 | 2025-26 | 2026-27 (projected) |
|---|---|---|---|
| Funding received through the Department for Transport / UK Government | £3,117,000 | £6,598,000 | £11,559,000 |
| Additional highways maintenance funding provided by the Council or third parties | £1,993,000 | £2,330,000 | £2,827,000 |
| Total | £5,110,000 | £8,929,000 | £14,386,000 |
Our plans for highways maintenance for 2026-27
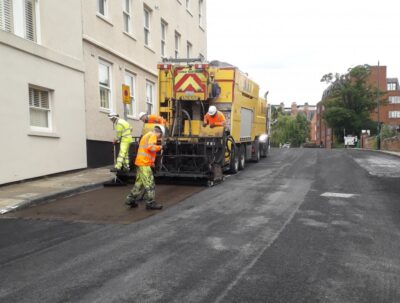
Our planned highway maintenance programme, funded by Central Government and the Department for Transport, uses a data driven approach to direct maintenance work to where it will provide the greatest benefit. We use a range of different treatments (described in more detail here) to preserve, repair or improve the condition of our roads and footpaths. Between April 2026 and March 2027, we’re proposing to:
- Resurface more than 7.5 km of roads across the city
- Resurface a further 1.3 km of footpaths
- Apply preventative thin surfacing treatments to more than 3.5 km of roads
Alongside our planned highway maintenance programme, we will be embarking on the fourth year of our popular Streets for People programme of neighbourhood improvements to make getting around easier and safer. The project has been running since 2022 and in that time has resurfaced or improved 223 roads, 86 footways, and planted or rejuvenated 290 trees.
Thanks to £7million of funding received from the East Midlands Combined County Authority from the second half of 2026 through to March 2028, the Streets for People project will enable us to:
- Resurface more than 7.5 km of local roads, including but not limited to Greendale Road, Trent Lane, Lloyd Street, and Burgass Road.
- Apply preventative surface treatments to further 7.4 km of roads, including Hilcot Drive and Melbury Road.
Full list of planned carriageway and footway works
Details of individual schemes, including the chosen maintenance treatment and the source of funding, can be found on our website.
How decisions are made on our maintenance plans
We use Annual Engineering Inspections (AEI) to identify sections of road requiring some of form of treatment. This results in a list of candidate schemes larger than our annual maintenance budget can accommodate. A repeatable and auditable system of prioritisation, or value management, is used to rank candidate schemes and derive an indicative maintenance programme for the next three years. Our value management process combines roads condition scores from the AEI with other (risk based) criteria, such as maintenance hierarchy and volume of customer enquiries / reported defects, to arrive on a final score.
Value management is a risk-based process which tends to prioritise main roads as they carry more traffic. Our Streets for People programme takes a collaborative approach, with the roads that need attention put forward by local people and prioritised by their Councillors.